Navigation
To navigate between the five main views of BatScope, use the tab bar at the top of the window.
The Sequences and Calls views additionally provide a Details Pane that provides additional information and functions for the selected item. This pane can be shown by double-clicking a row (except the sequences spectrogram! see Tip in Sequences_View) in one of these two views or by clicking the Show Details button at the top of the window.
Note
Most of these views contain tables.
Not all columns are displayed in these tables by default - to see the available columns, click the small + at the top-right of the table. Use the Columns dialog in the Edit menu to further customize which columns are visible after pressing +.
You can sort the tables based on the contents of a column by clicking on the header of that column. This cycles between ascending, descending and unsorted settings.
Hold the Shift key to sort by multiple columns.
Columns can be rearranged by dragging their headers to a different position and resized by dragging the edges of their headers.
Tip
Various keyboard shortcuts are available for common actions and faster navigation.
See the Shortcuts menu for details.
Projects View
The projects view is used to manage projects and collections.
You can
create New projects
Delete existing projects and collections (*)
Archive projects (to move them out of the workspace) (*)
Load archived projects (to move them back into the workspace)
Reset projects (remove all calls, classifications and verifications) (*)
Delete projects or collections (*)
Commands marked with (*) operate only on a single highlighted line of a project (or collection in case of Delete), not on selected items.
Important
Here you can filter which collections have their sequences and calls displayed in the other views. To do so, select the desired collections using the checkboxes, then make sure the Collection Filter button is toggled on. Toggle off the Collection Filter button to show sequences and calls from all collections.
Sequences View
The sequences view is used to display and manage sequences, including filtering and processing.
Note
The sequences that have been imported directly from BatScope 3 and have not been processed in BatScope 4 or are invalid in some other way will have a red frame around the Processing field and need to be reprocessed from the start, i.e. from the Cut stage.
Verifications will not be removed when reprocessing.
Tip
Double-clicking on the spectrogram of a row will switch to the calls view and show that sequence’s calls.
Calls View
The calls view is used to display and manage calls.
Important
The green Status checkbox of each call determines whether it will be counted in the classification of its sequence.
Details Pane
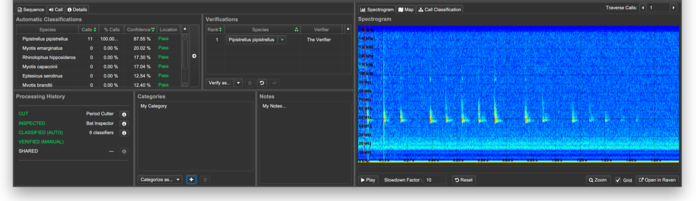
Figure 4 The details pane
The Details Pane can be opened from the Sequences View and Calls View views by clicking the Show Details button or double-clicking a row (but not the spectrogram!).
Note
Double-clicking the spectrogram in the Sequences View will switch to the Calls View and show the calls for that sequence instead.
This pane consists of multiple tabs providing additional details and functions for the selected element.
Tip
When viewing details for a sequence, cycle through the calls in the sequence using the Traverse Calls selector (top right in Details Pane).
Sequence
- Automatic Classifications
The classifications of a sequence as determined by the Classify process.
Double-click a classification to add the species to the verifications.
The columns are:
Species - the determined species
Calls - the number of calls classified as the species
% Calls - the percentage of calls classified as the species
Confidence - the overall confidence of the classification
Location - the result of the location test, based on the range base
- Processing History
Details of the processing state, including which processors were used for each stage. Click the i button to the right to show details of a processor.
All stages are white if unprocessed, green when successfully processed and red when outdated.
The classification is marked (Auto) if the verifications match the automatic classifications, and (Manual) otherwise.
The verification is considered (Auto) if it was assigned in batch using a process, and (Manual) if assigned individually using the buttons in the detail pane.
- Verifications
The species assigned to a sequence by the user.
Use the buttons below to add or remove a verification. Here you can also reset or revalidate all verifications after a change, such as rerunning the classification process.
The columns are:
Rank - used to number verifications in case there are multiple species in a sequence. Reuse the same rank to indicate an uncertain verification. Edit by double-click, finish entry with Enter/Return.
Species - the determined species
Verifier - the person who performed the verification. You will need to set this name in the Preferences before verifying.
- Categories
The categories assigned to this sequence. Categories are user-defined labels that can be applied to sequences across projects.
Use the Categories dialog in the Edit menu to manage categories. You can also create a new category directly by clicking the + button.
Deleting a category here will only remove it from this sequence.
- Notes
Custom text associated with the sequence.
Call
- Spectrograms
Original - an enlarged view of the spectrogram calculated from the audio file
Filtered - the spectrogram filtered during the Inspection process
Binned Features - a trace of the main intensity over frequency and time, separated into 5 bins
- Properties
The most important characteristic qualities measured from the call.
Details
More details on the recording and the recording device used.
Spectrogram
A detailed view of the spectrogram, also indicating the position of the active call, selected with the Traverse Calls stepper.
You can Play the sequence audio. Select the desired play back mode in the Preferences.
Select Open in Editor to load the current sequence audio in the selected audio editor, which provides you with more spectrogram display options. The path to the audio editor must be provided in the Preferences.
Warning
Only Raven Pro 1.4 or 1.5 will work with this function, not Raven Pro 1.6.!
Select Show File to see the wav file of the respective sequence in your file browser.
Select Zoom to open the spectrogram in its own window.
Map
A visual plot of the recording location if available.
Tip
Select an entry in the Automatic Classifications pane to show the species’s range on the map according to the range base set for the project.
Call Classification
- Statistics
Details on the composition of the classification result for the chosen call.
The columns are:
Species - the determined species
Confidence - sum of the confidences of all votes for this species
Votes - number of classifiers naming this species
Votes (MLS) - number of classifiers naming this as the Most Likely Species
- Classifiers
Details of the output of each classifier showing the detected species and calltype with the confidence of each classification.
Note
Classifications are only shown down to the confidence level set in the Preferences.
Taxonomy View
The taxonomy view shows additional information on the species in the current species set.
The Acoustics tab shows characteristics of the species’ echolocation calls.
Numeric values on bat call amplitude plots indicates mean values of call duration (with 95% confidence interval), in unfiltered (green) and filtered signals (red).
- Numeric overlays on bat call spectrograms indicate from top to bottom mean values for:
highest call frequency (top center, with 95% confidence intervals left and right), in unfiltered (green) and filtered signals (yellow)
frequency of highest energy (center rigth in pink, with 95% confidence interval above and below)
lowest call frequency (bottom center, with 95% confidence interval left and right), in unfiltered (green) and filtered signals (yellow)
and the sample size n for the respective statistics
Tip
You can play the sample sequence at the same time as one of your own sequences for comparison.
The Literature Values of characteristic call measurements are taken from the publications:
Schober, W., and Grimmberger, E. 1987. Die Fledermäuse Europas - kennen - bestimmen - schützen. Franckh’sche Verlagshandlung, Stuttgart.
Dietz, C., Helversen, O.v., and Nill, D. 2007. Handbuch der Fledermäuse Europas und Nordwestafrikas. Kosmos Verlags-GmbH, Stuttgart.
Skiba, R. 2009. Europäische Fledermäuse. Westarp Wissenschaften, Die Neue Brehm-Bücherei.
- The other tabs are integrated web browsers of the respective species’s web-pages:
the distributional map as provided by the Swiss Centner for the Cartography of the Fauna (CSCF)
the Global Biodiversity Information Facility (GBIF)
the international Red List Status from the International Union for Conservation of Nature (IUCN Red List)
the information page of Bat Conservation Switzerland (SSF)
Wikipedia
Process Log
This view logs information on the processes run since the last startup of BatScope 4.
If a process fails or encounters an error or warning, the process will contain details of the cause and the sequences affected.